Page Speed
The dashboard has a new Page Speed section: it measures page load speed in a real browser, with a load video, a waterfall and recommendations on what to fix.
What's inside
All of the organization's runs are in one list. Each shows the page, device, deploy and main metrics. Scheduled runs come with bars for the latest passes, so you can see how speed changed from deploy to deploy.
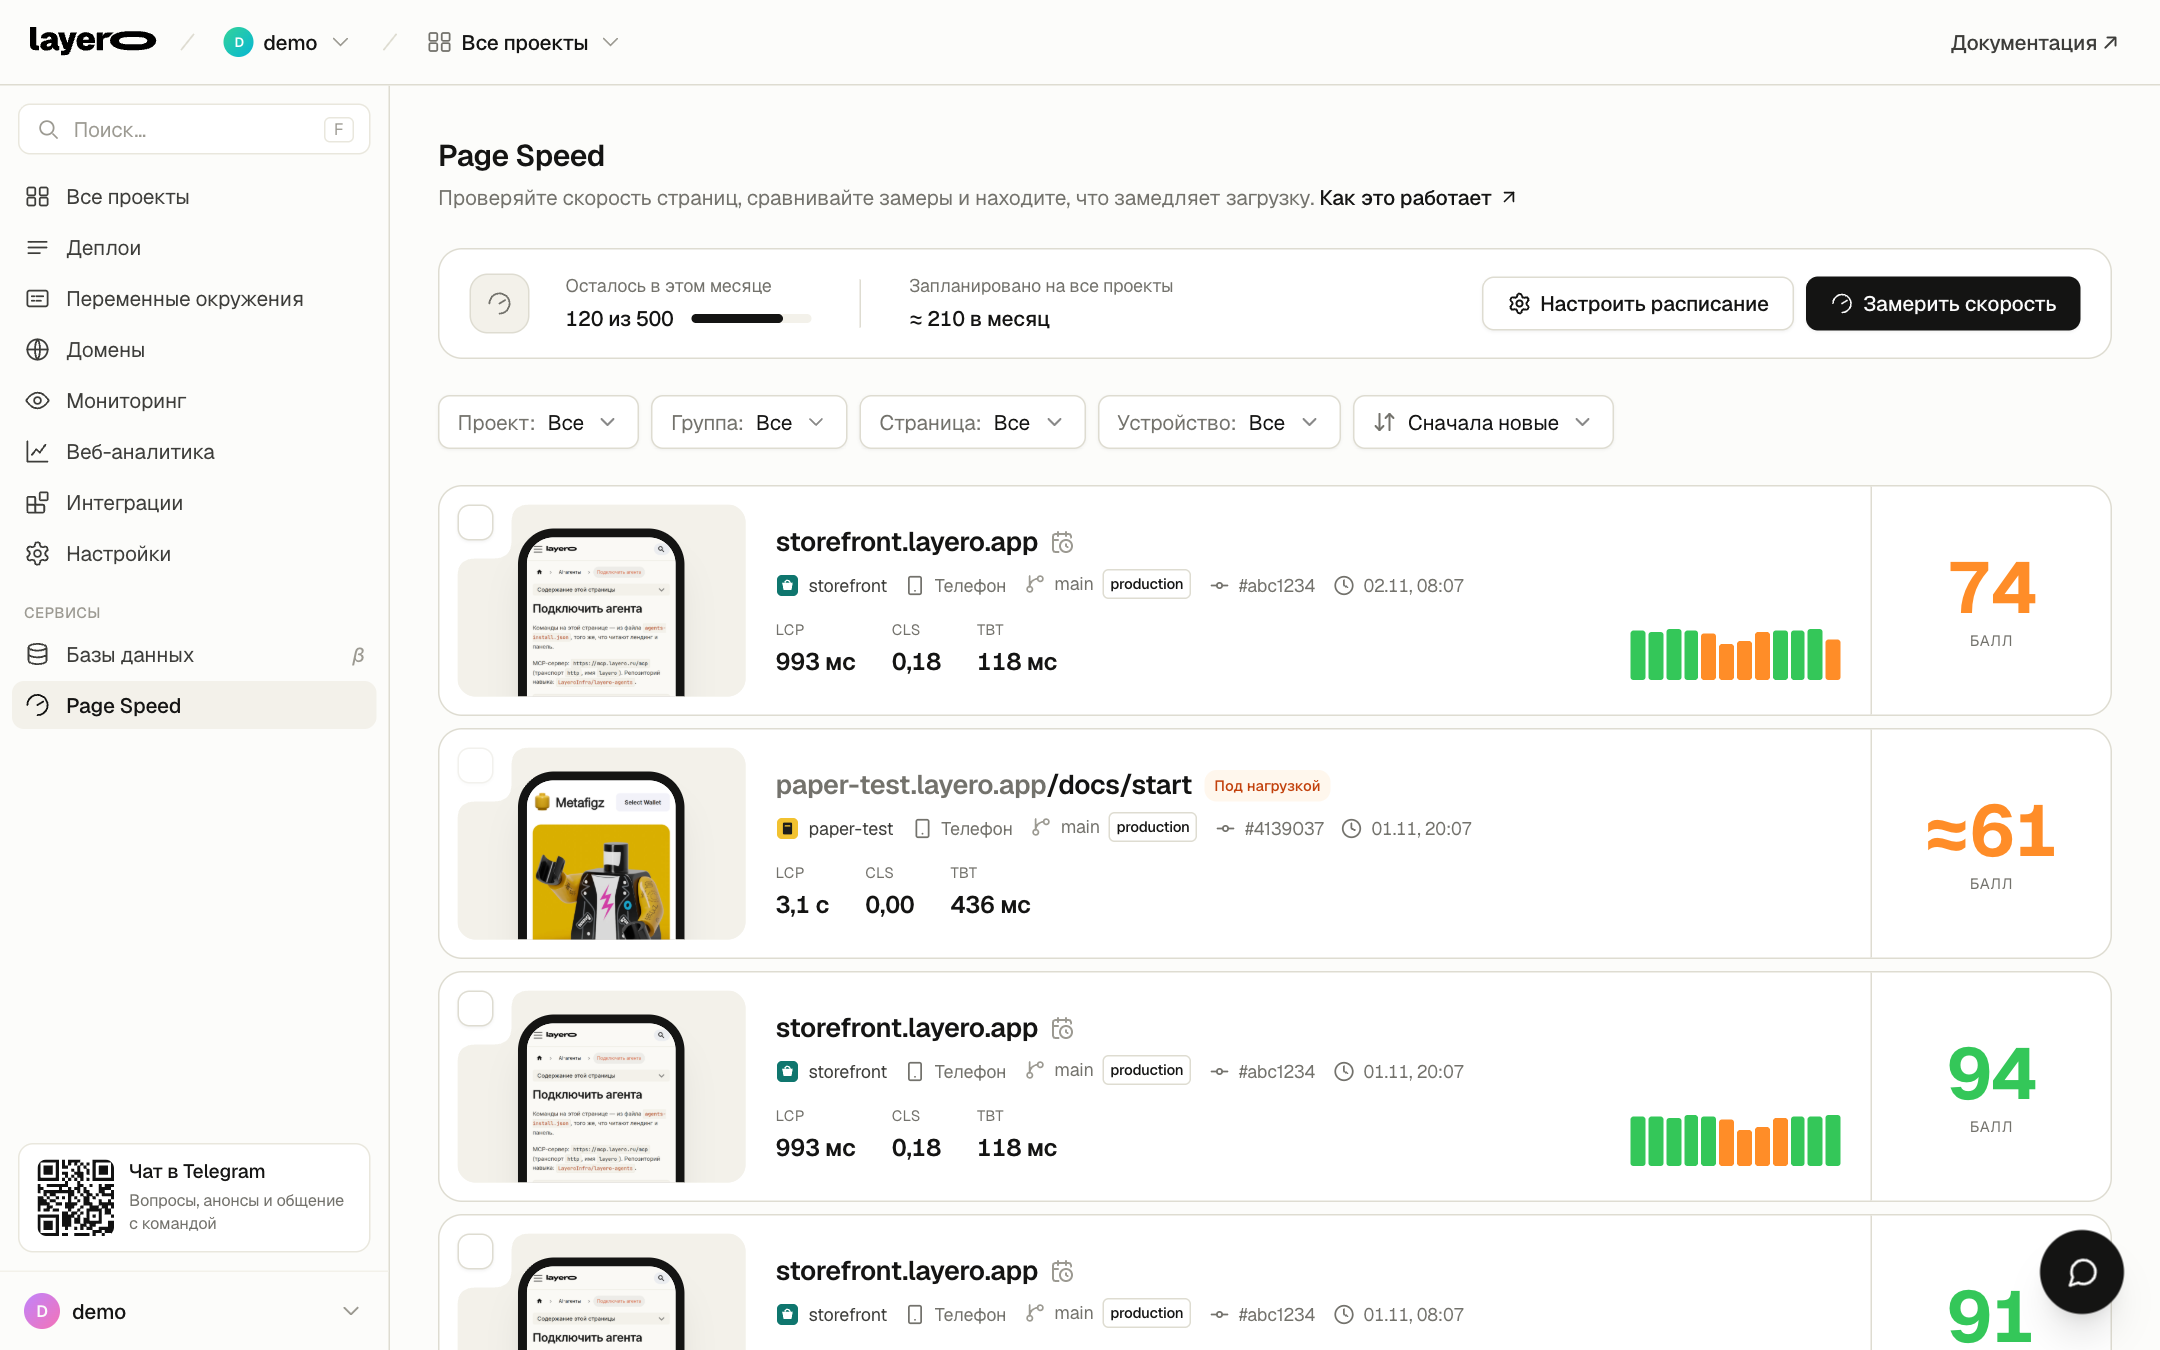
A real browser
The page opens twice in Chrome, just like for a visitor. The run records a video, every request and the main thread's work.
Phone or desktop
Network and CPU speed like a real visitor's, the same for the video and for Lighthouse.
Comparison with the previous run
A new run is compared with the previous scheduled one. The "got worse" mark appears only when the difference exceeds measurement noise.
Schedules and Telegram
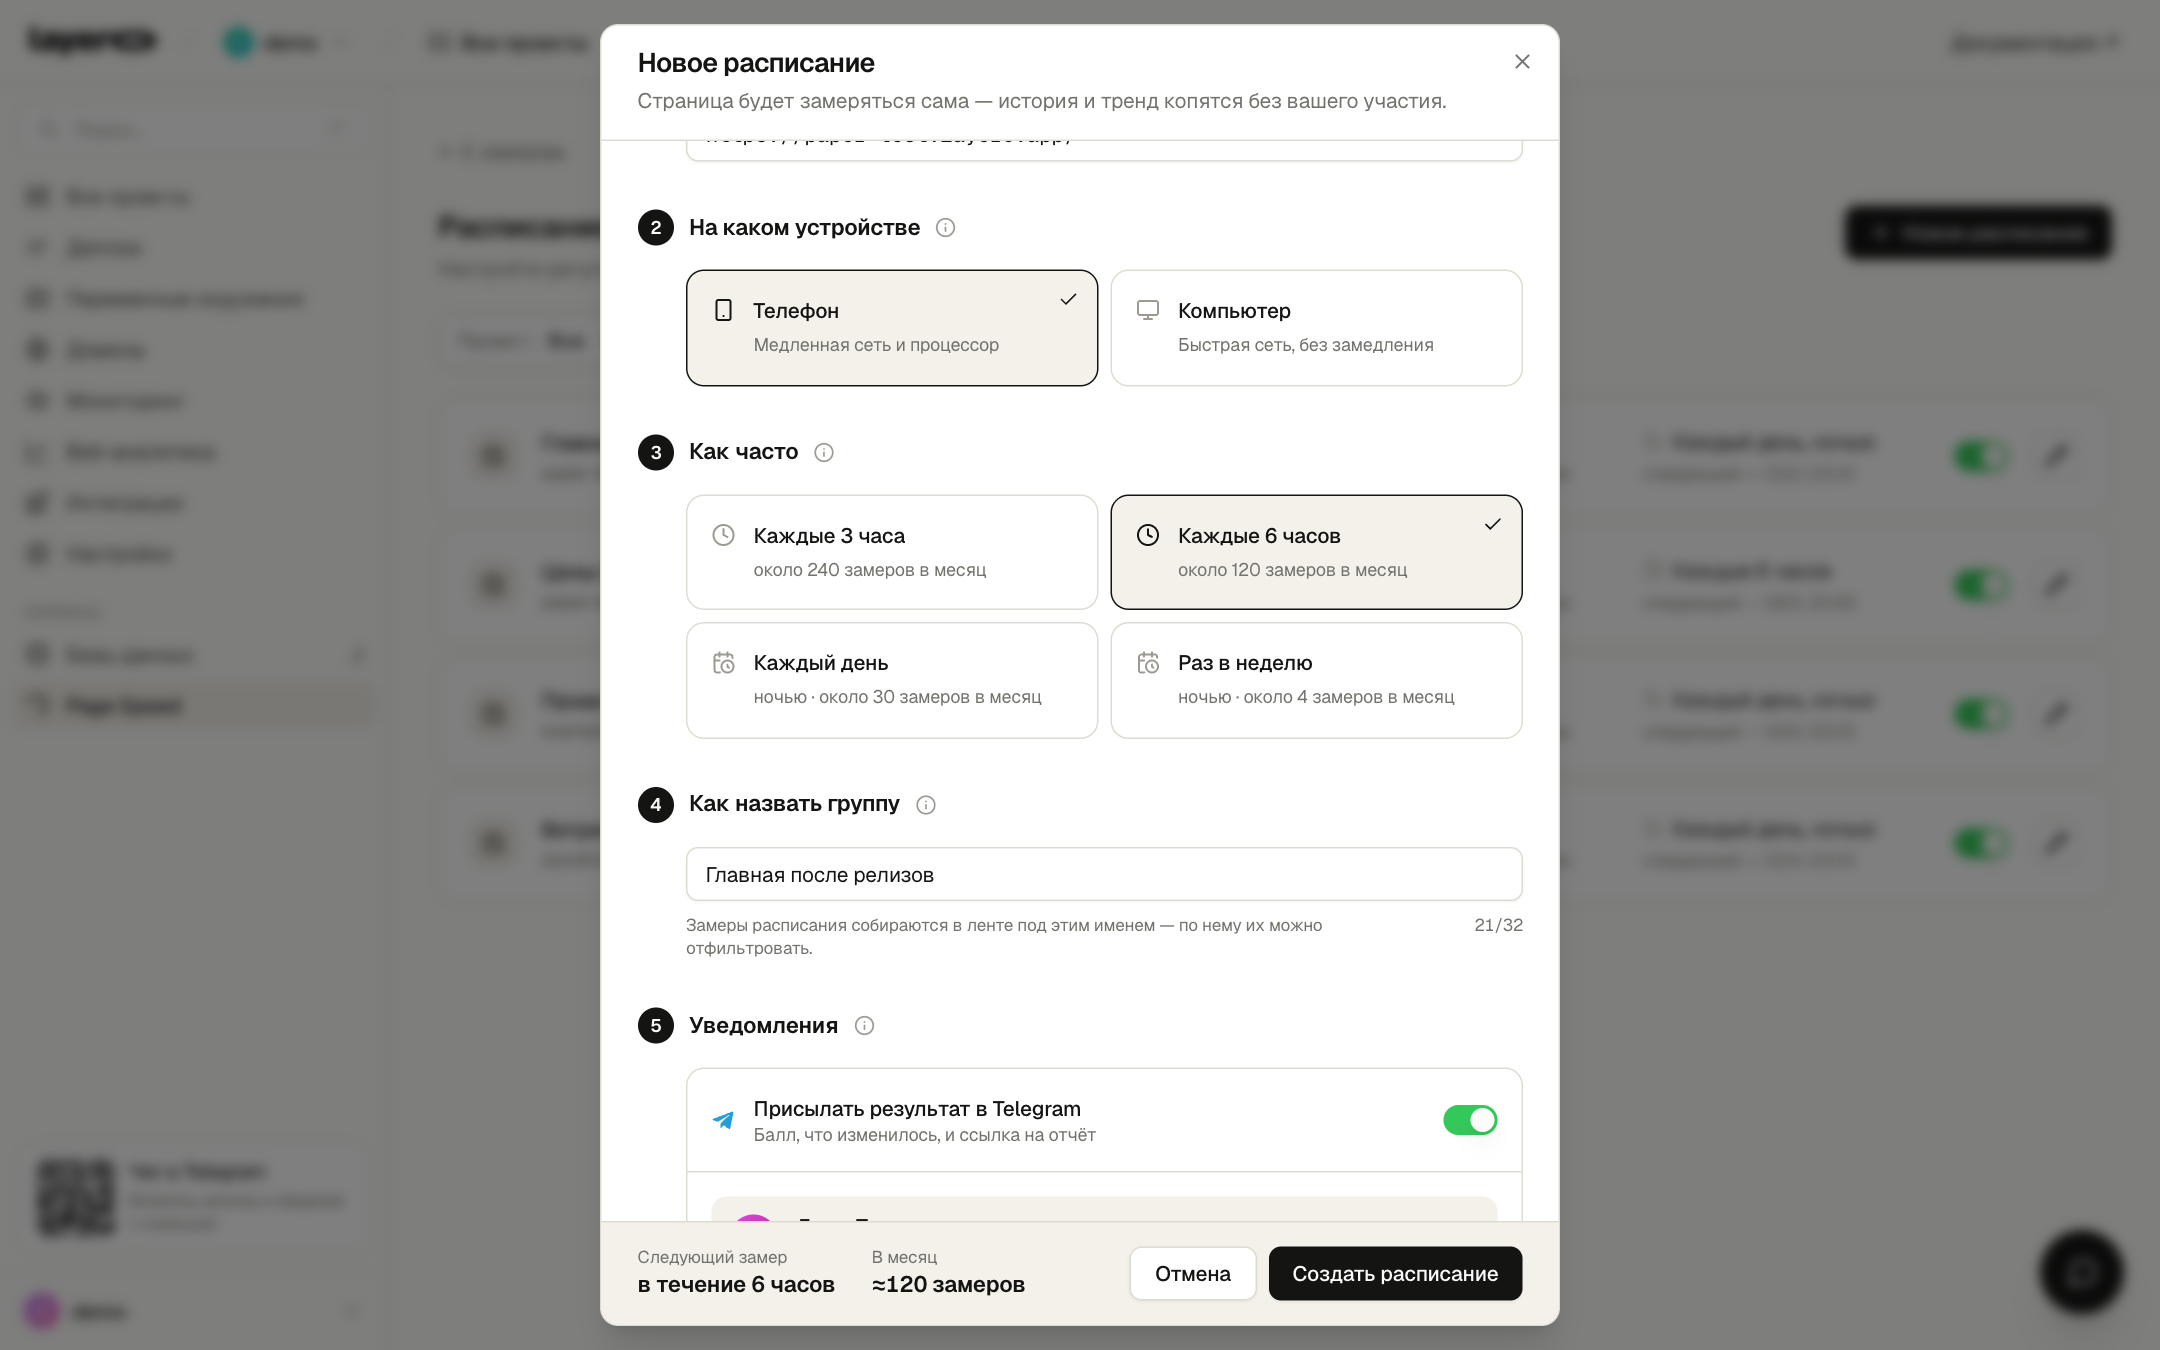
On Pro a run starts by itself every 3 or 6 hours, daily or weekly, and the result arrives in Telegram.
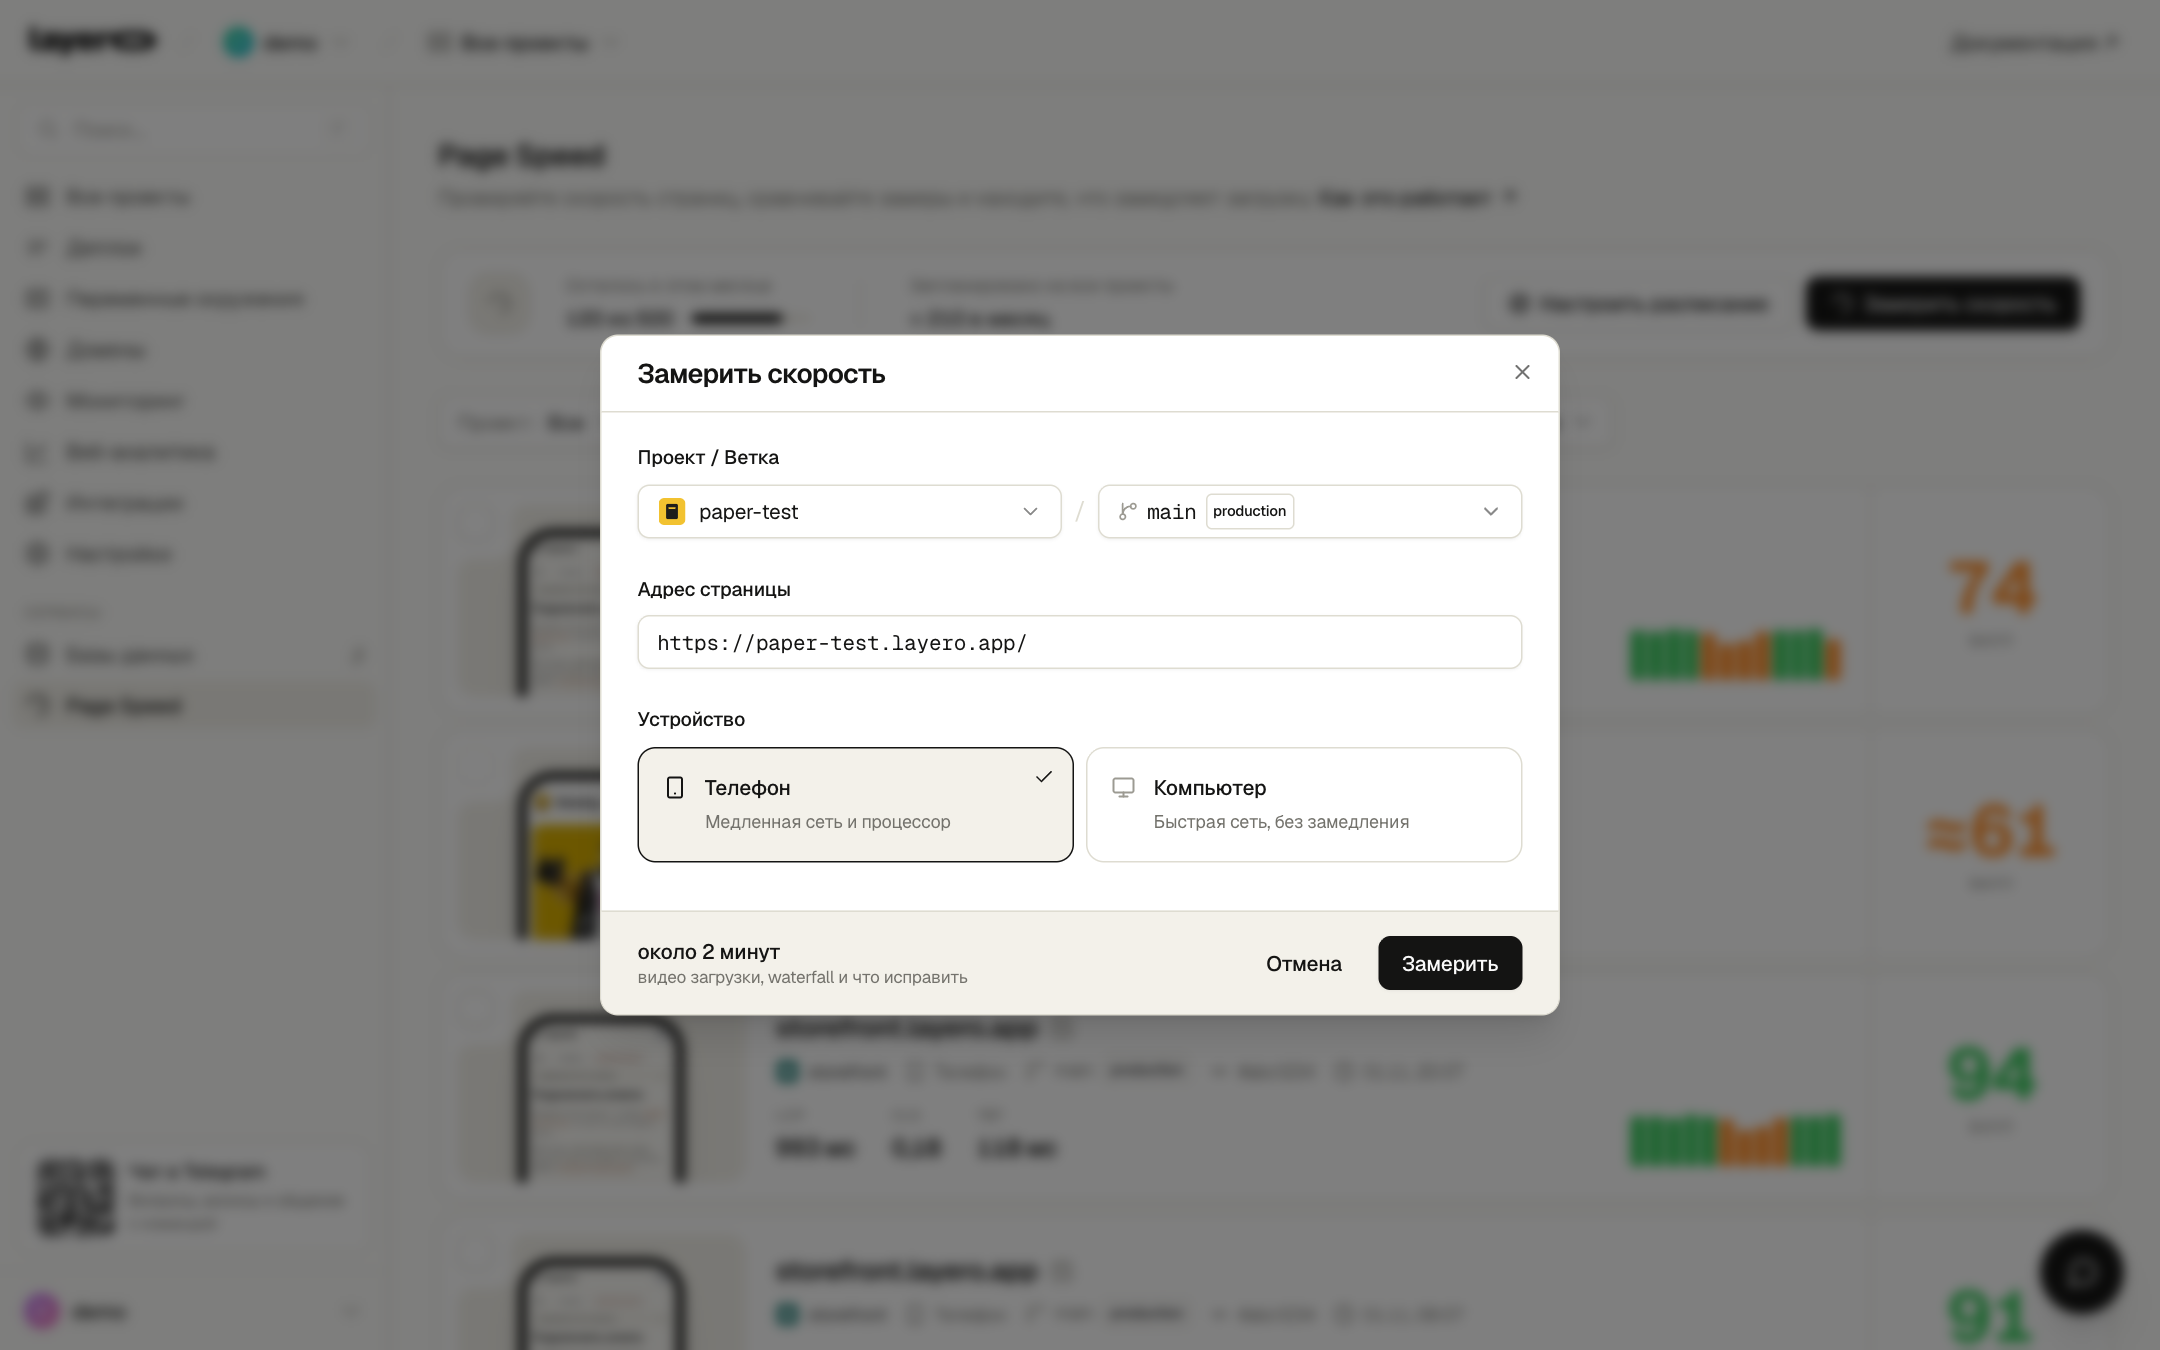
A run in two clicks
Pick a project, a branch and a page — with query parameters or on a connected domain if you like. Then a device. The report is ready in about two minutes, and the progress is shown right in the list.
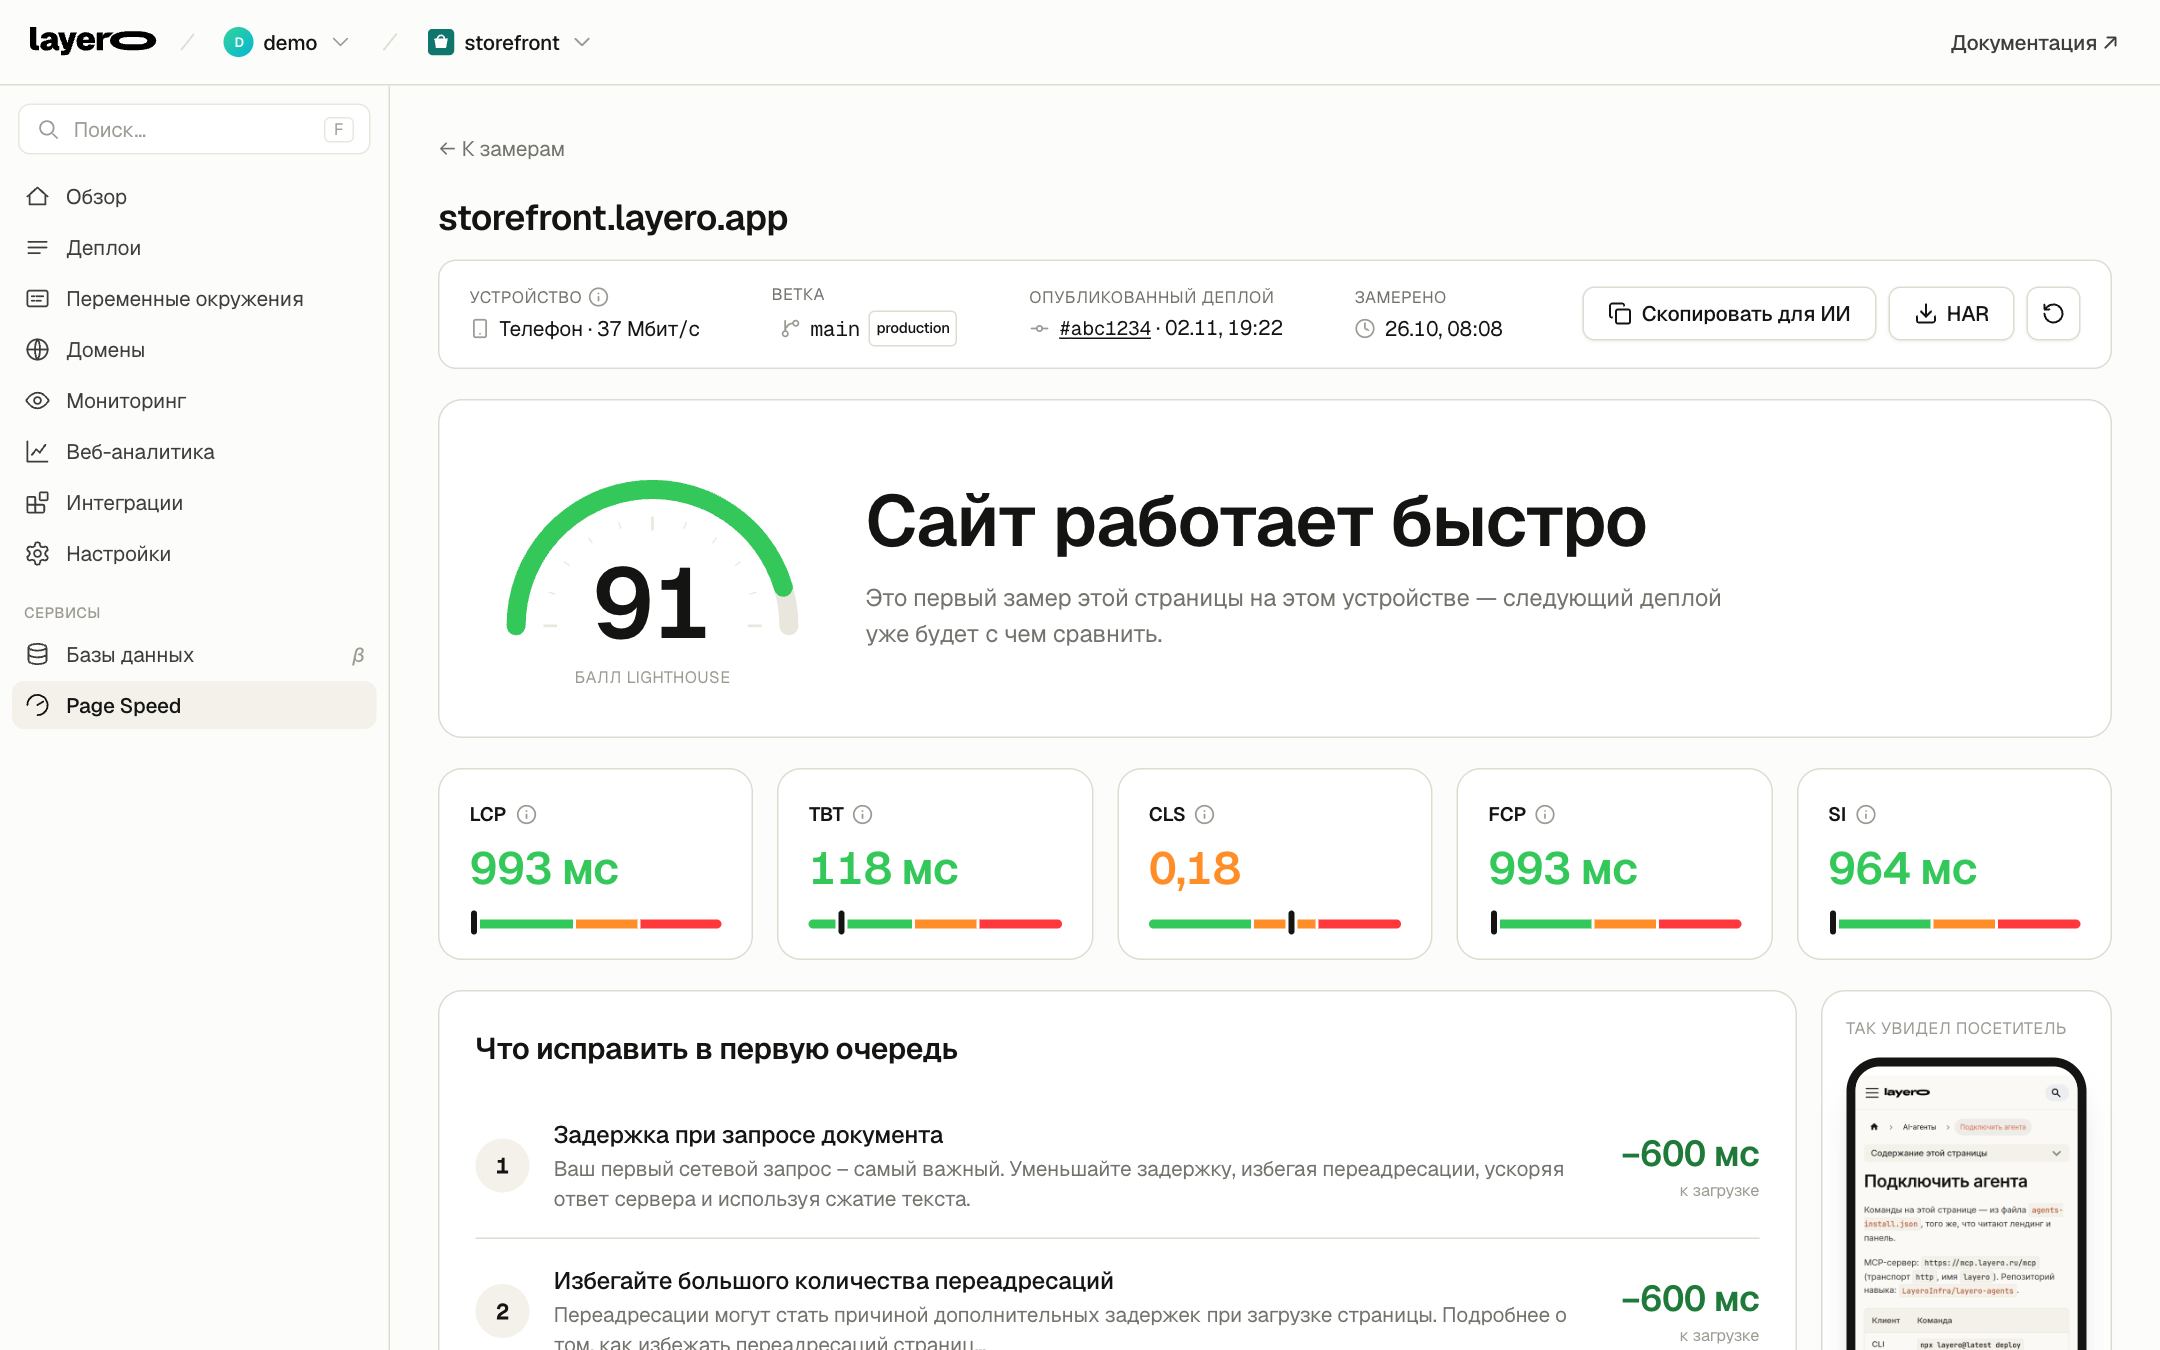
Report
At the top: the main load metrics — LCP, TBT, CLS, FCP and Speed Index, each on a scale with Google's thresholds. Below: what to fix first and how much time it saves.
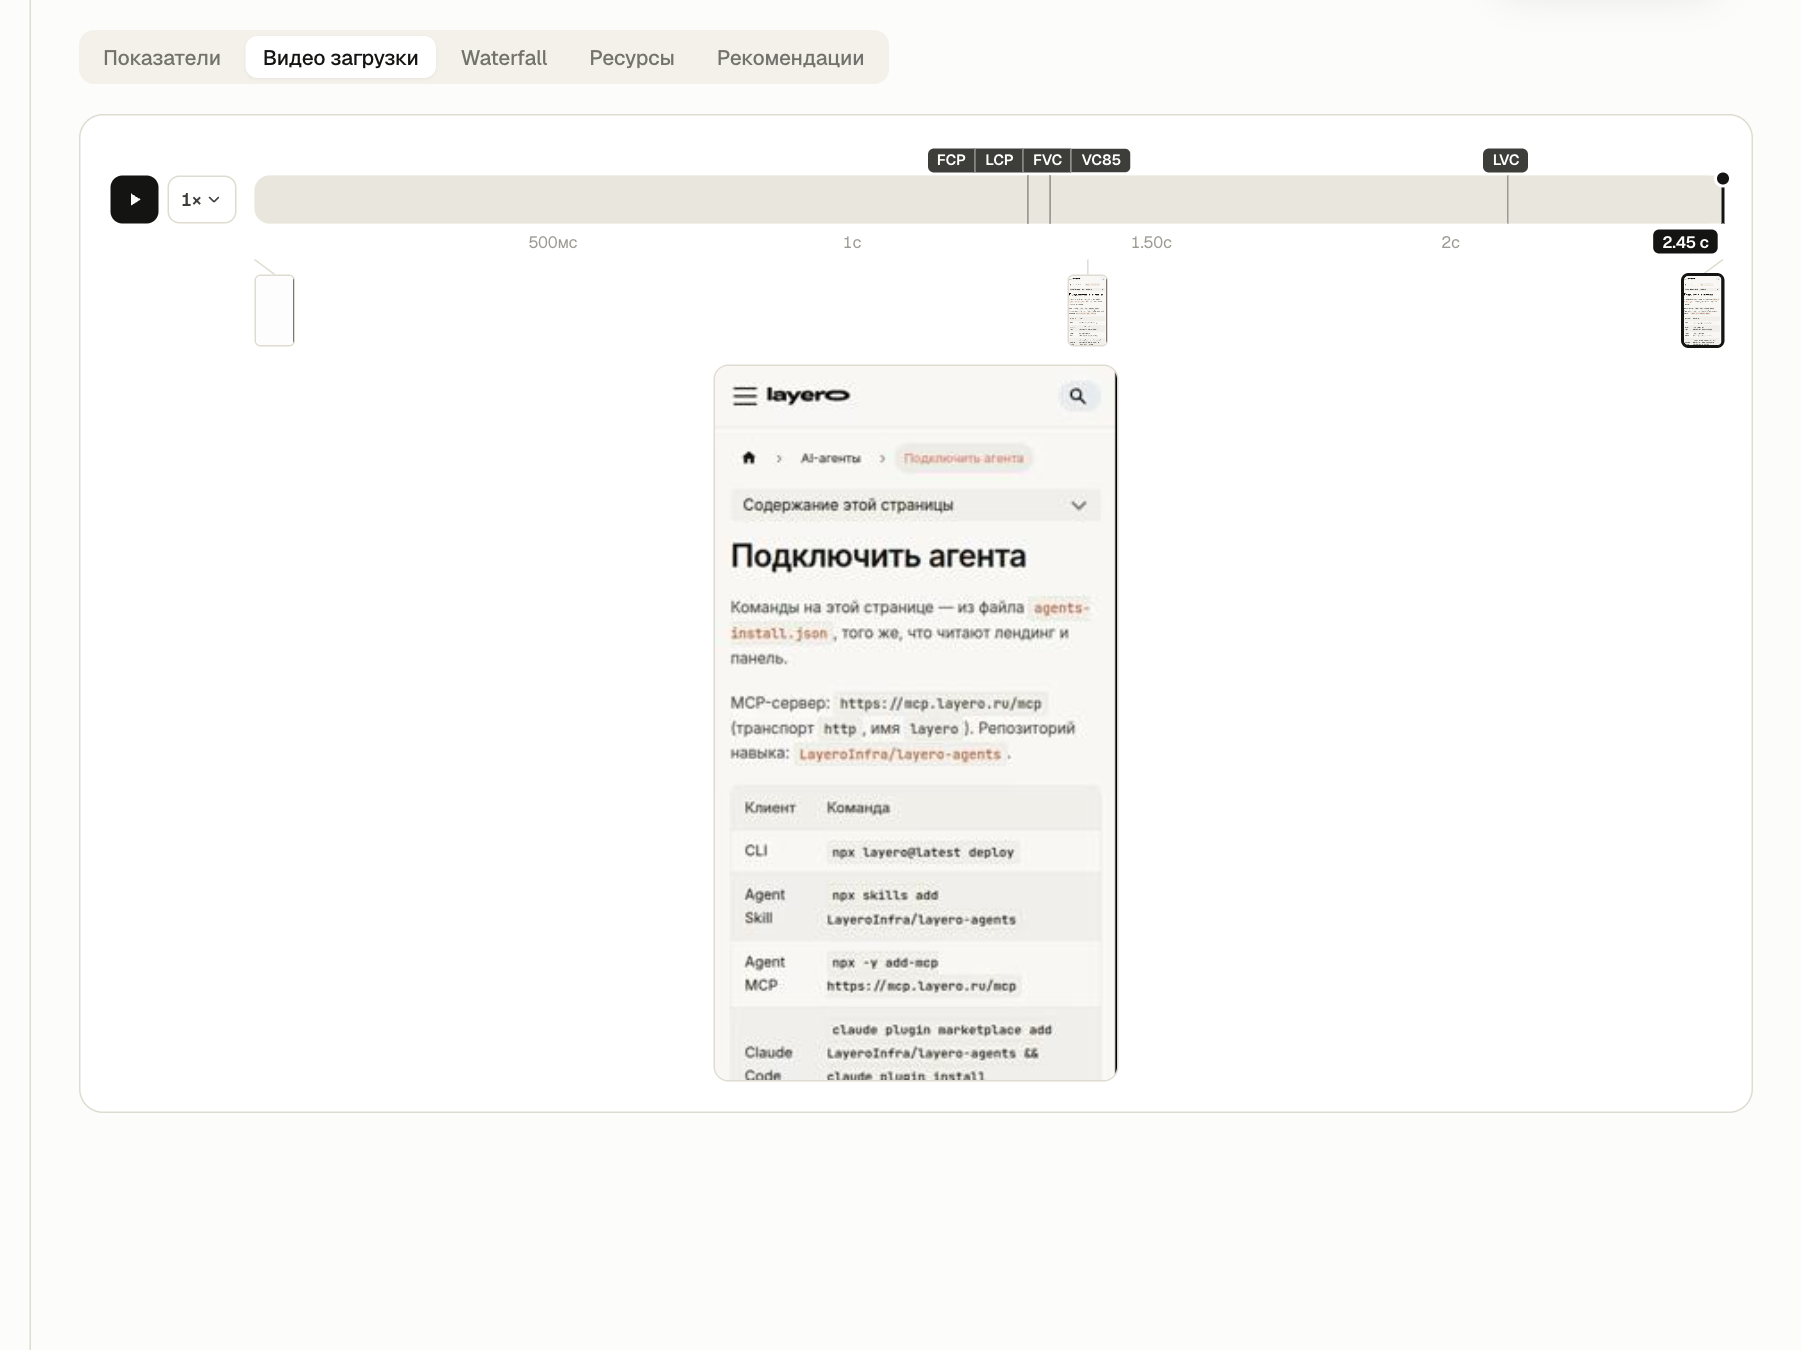
Load video
This is how a visitor saw the page: frame by frame, with marks for first paint, the main block and visual readiness. You can see how many seconds the screen stayed blank.
Waterfall
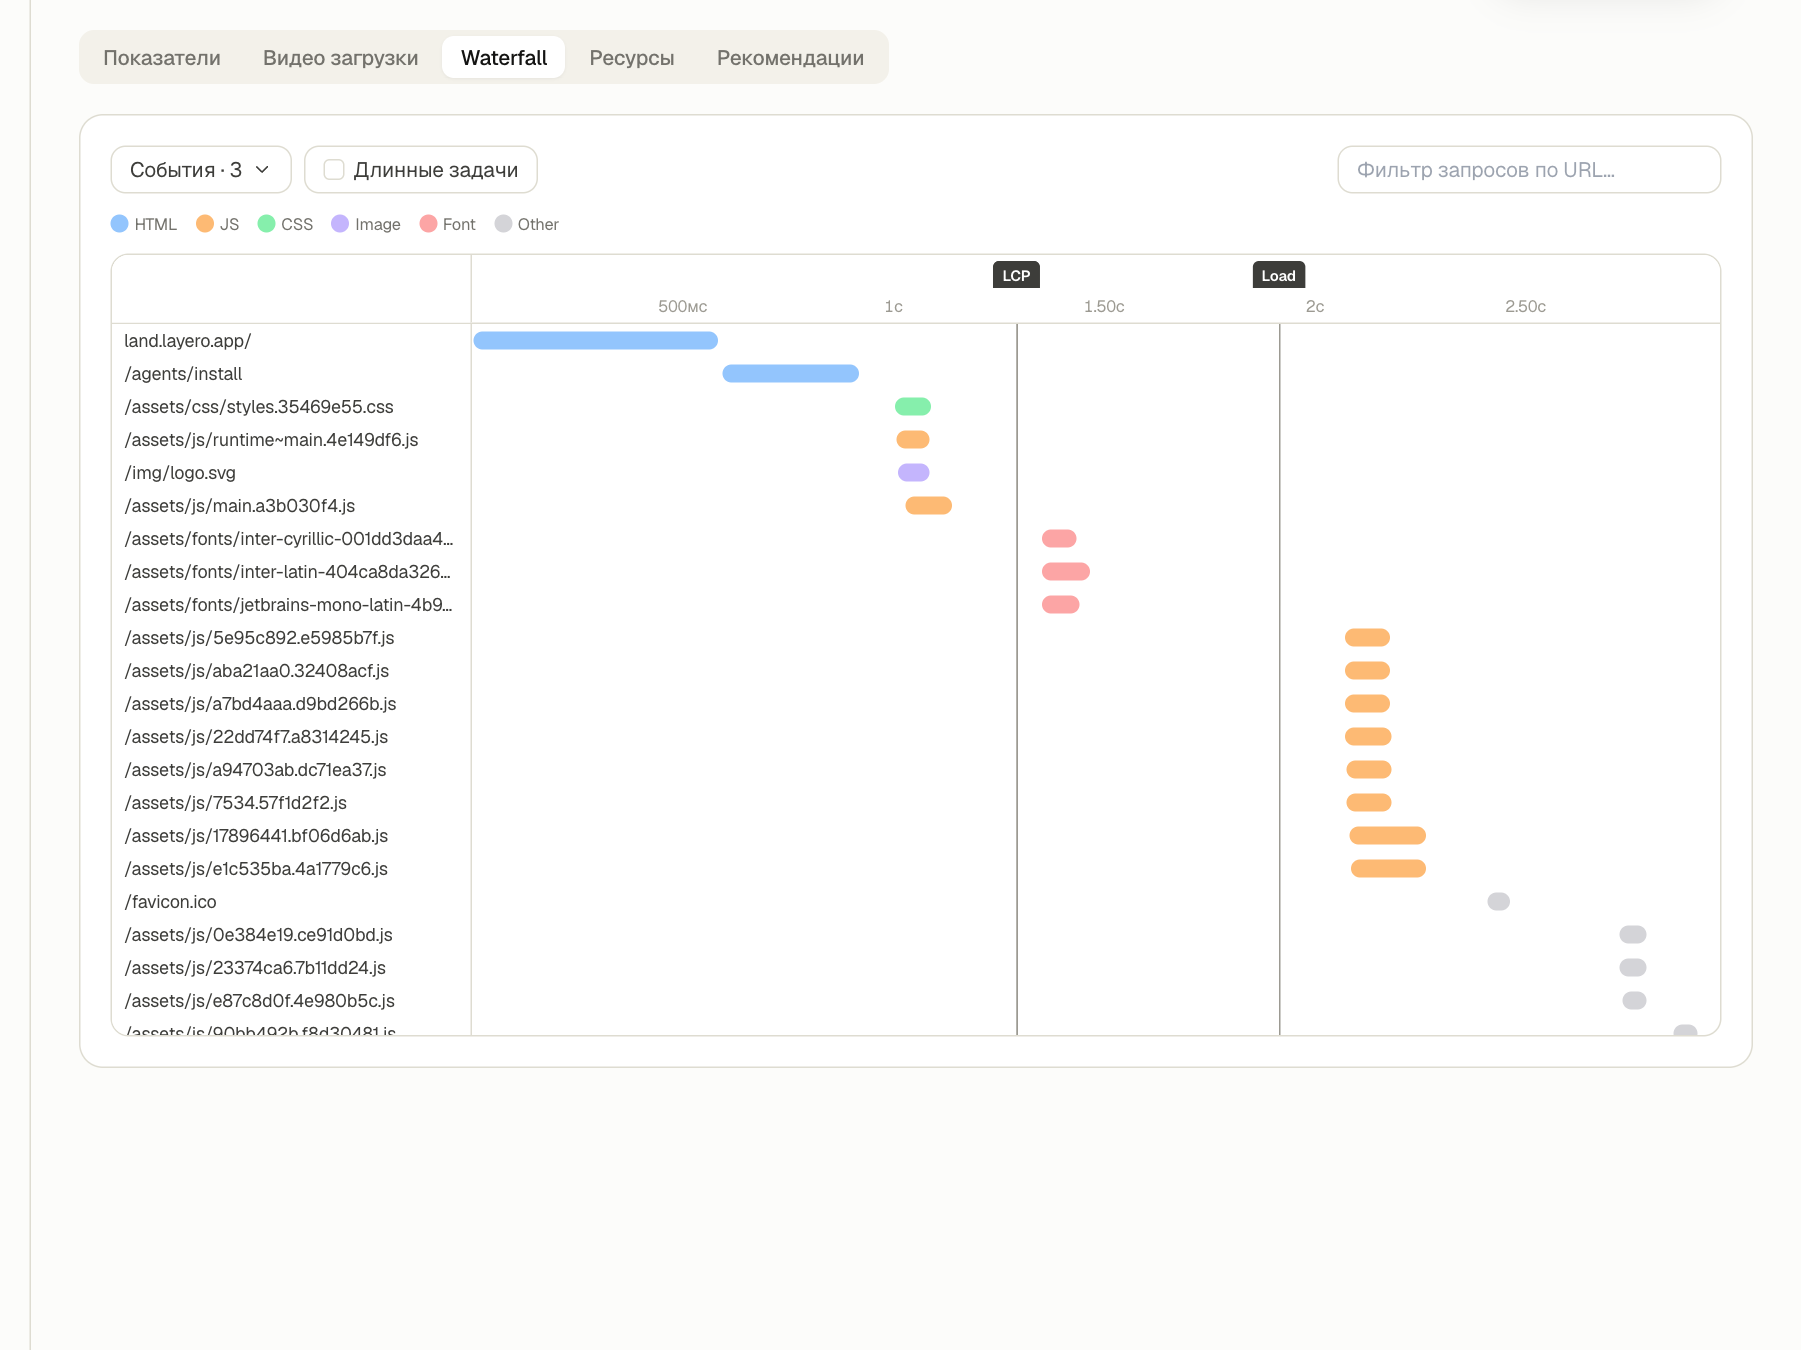
Every network request on a timeline, with event marks and long tasks of the main thread. This is where you see which file holds up everything else.
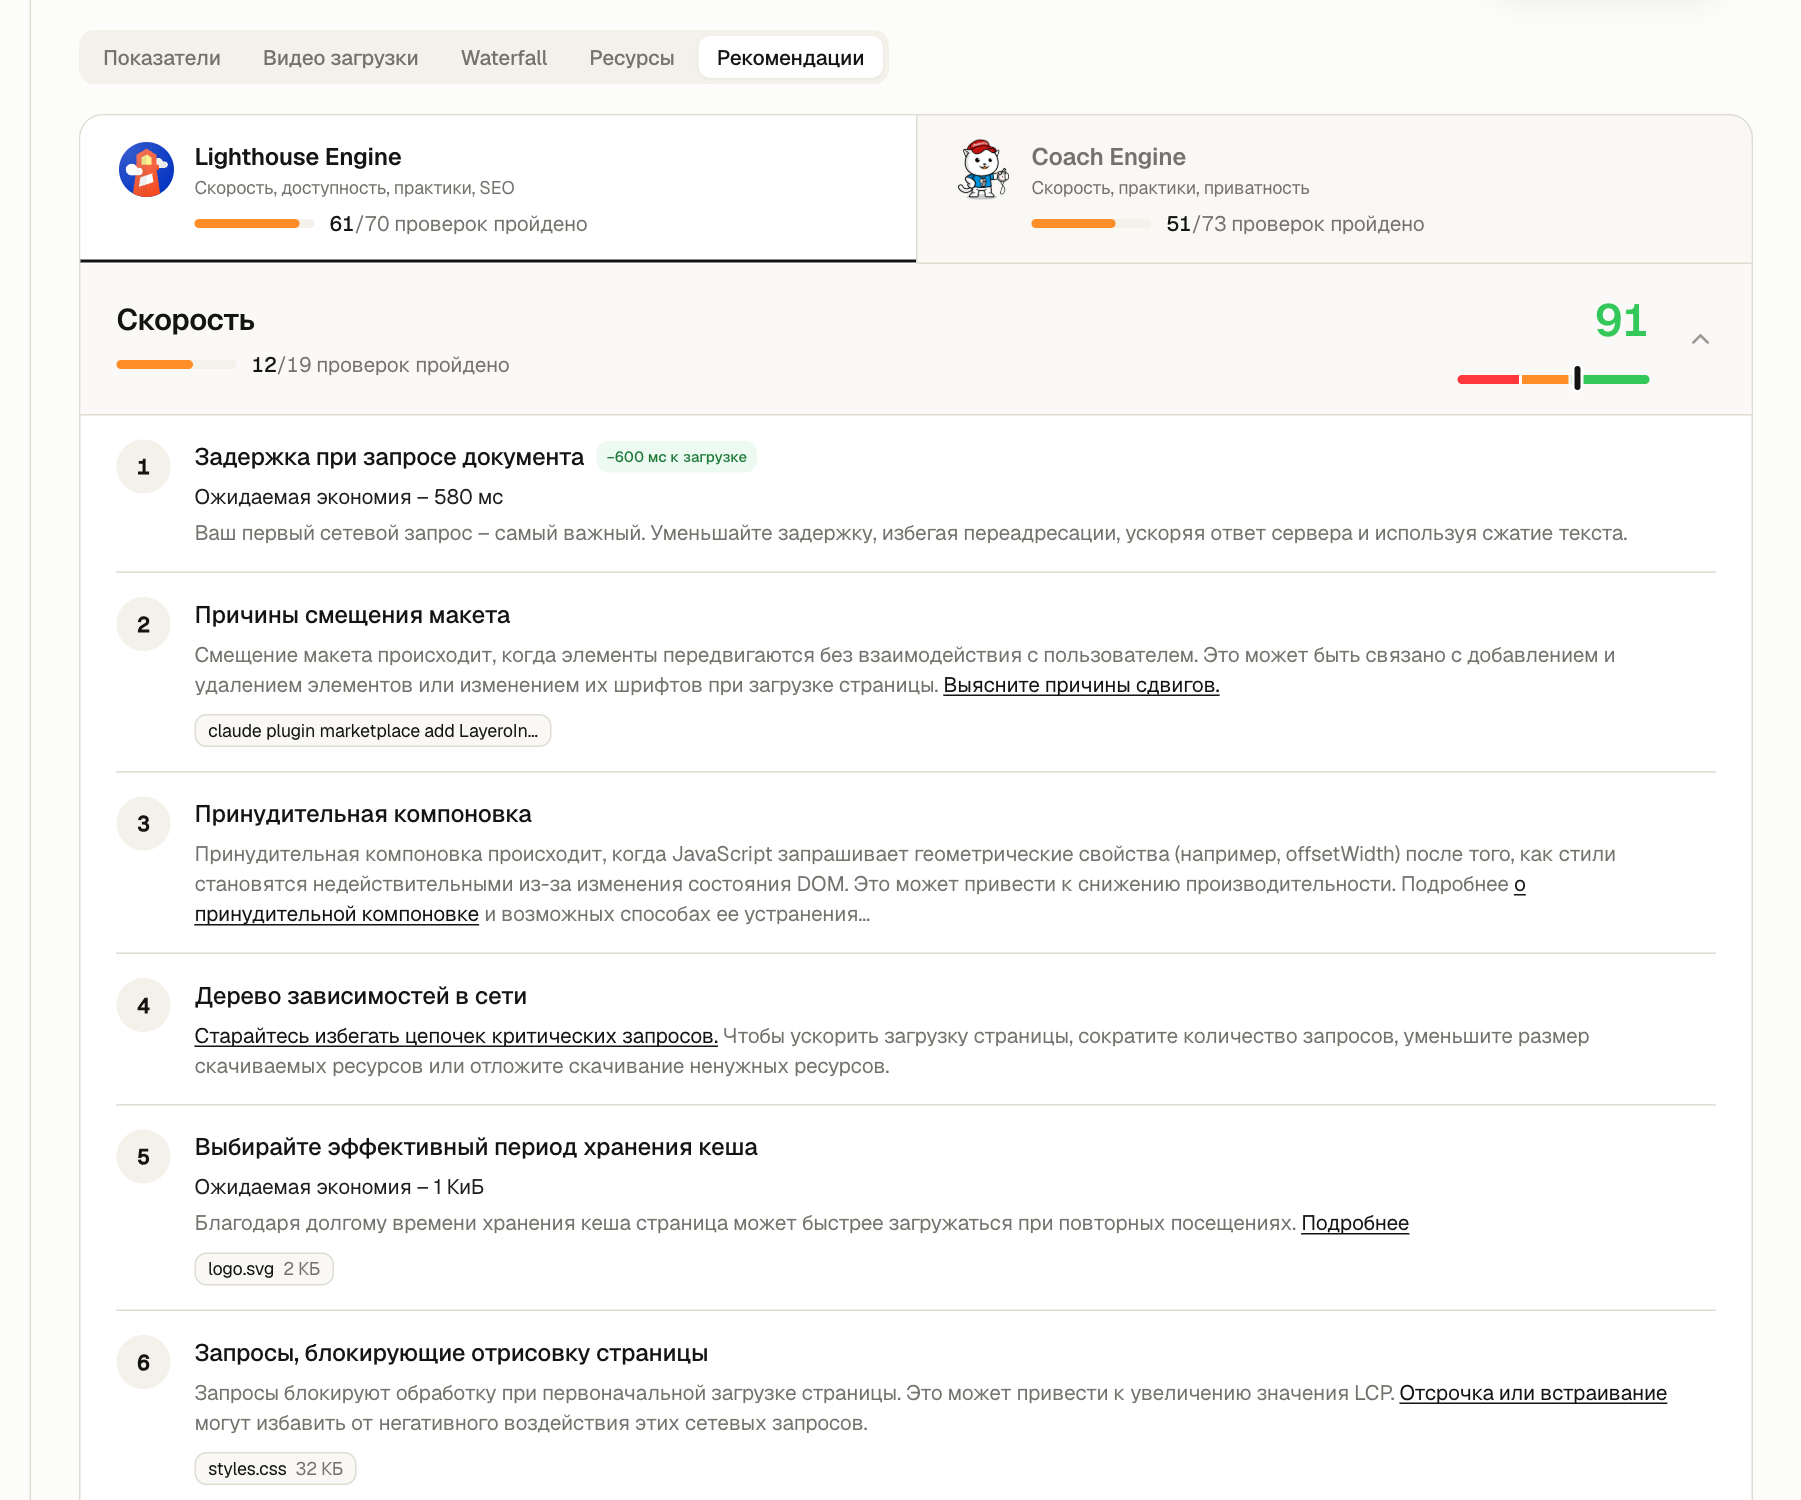
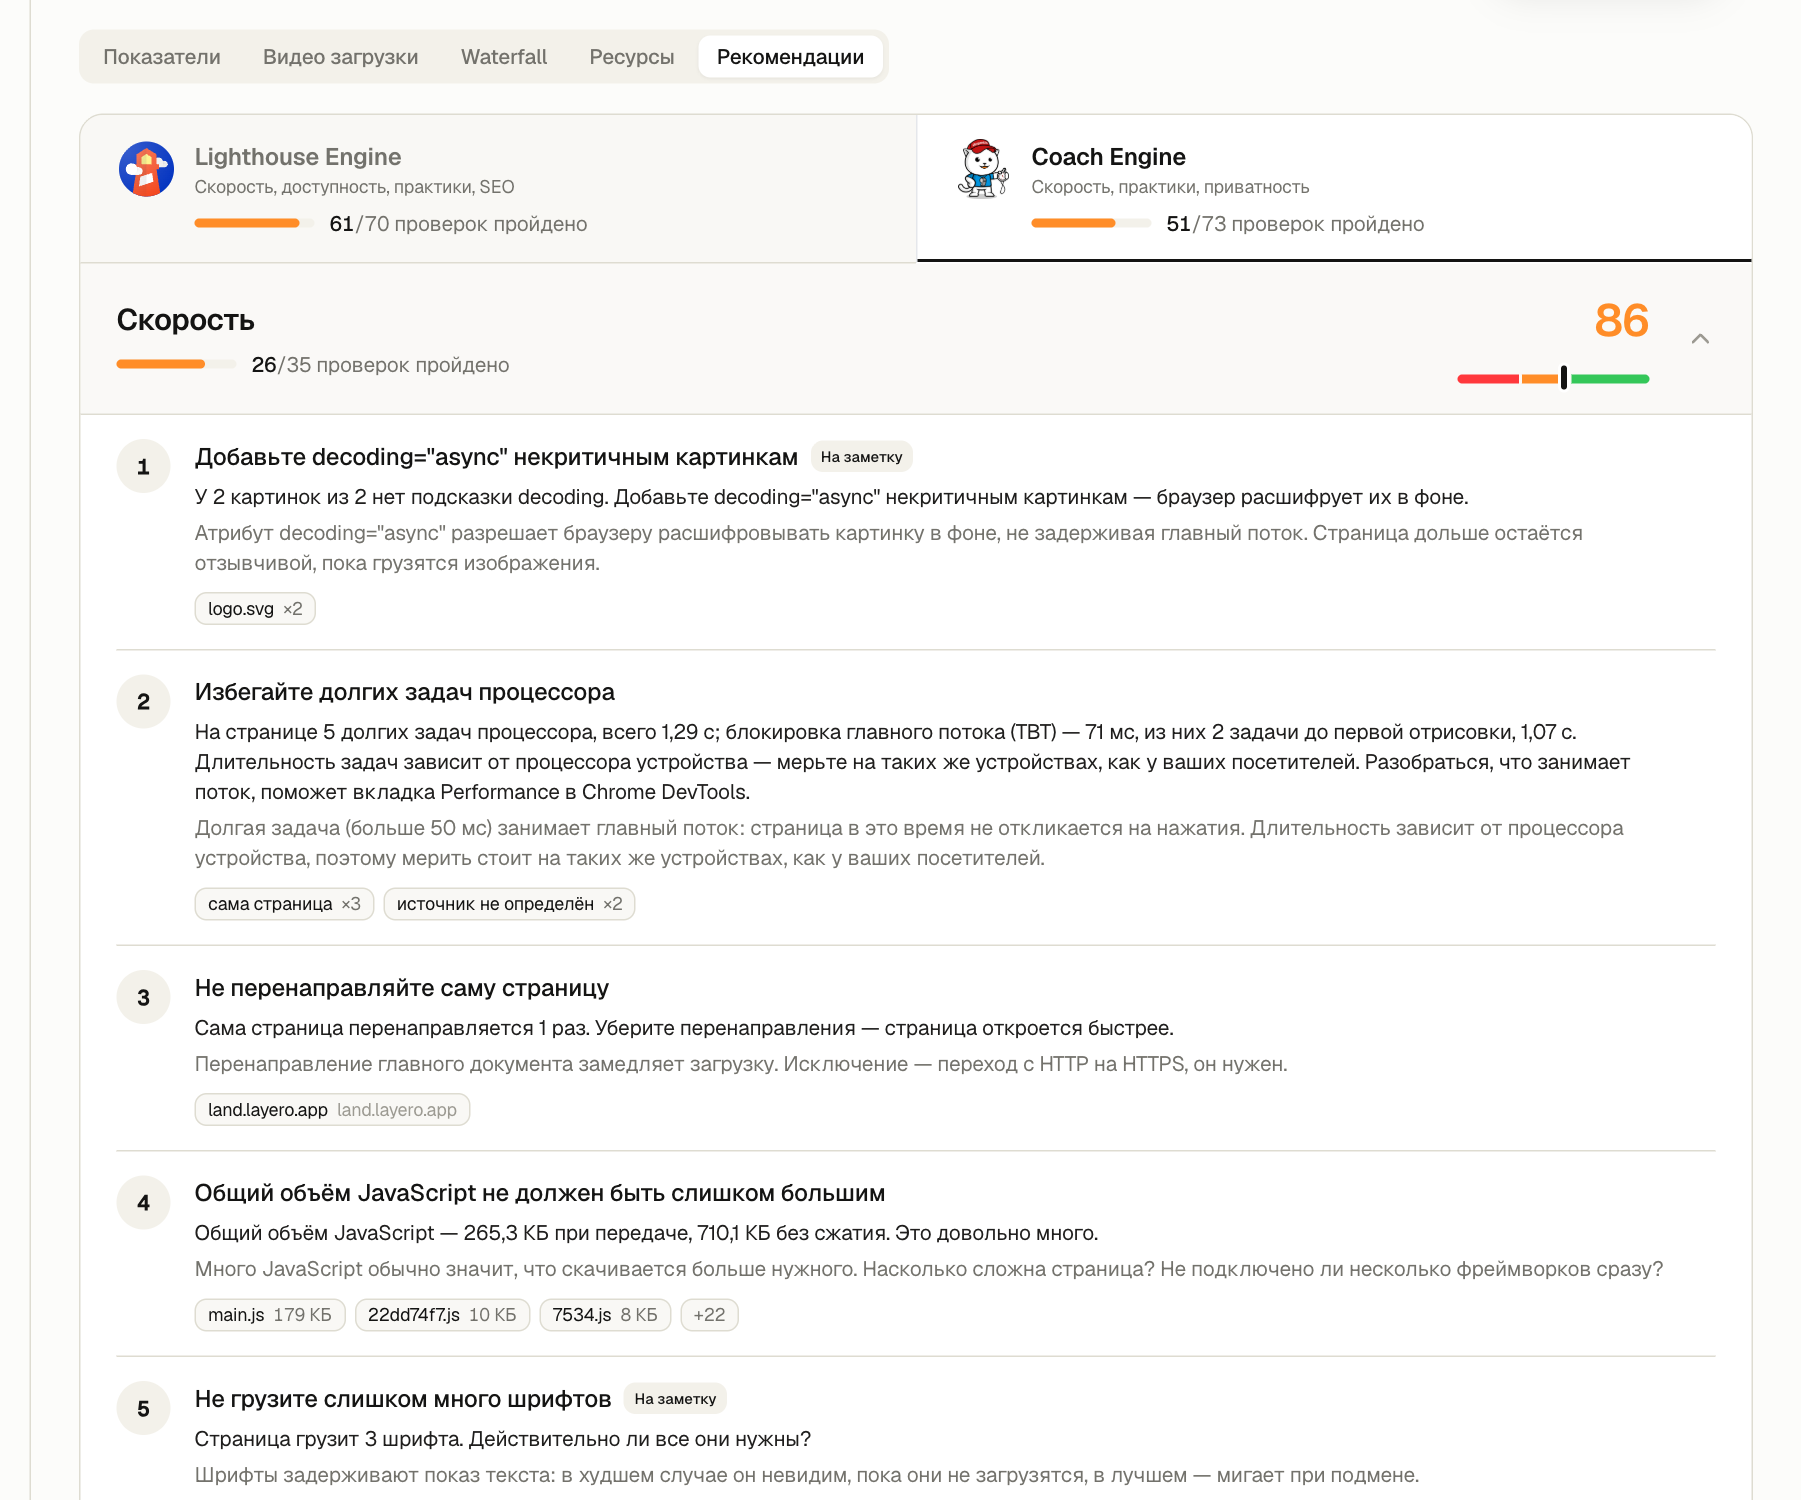
Lighthouse and Coach recommendations
Two sets of checks. Lighthouse covers performance, accessibility, best practices and SEO, and every suggestion shows the expected savings. Coach adds privacy checks and explains in plain words what's wrong and in which files.
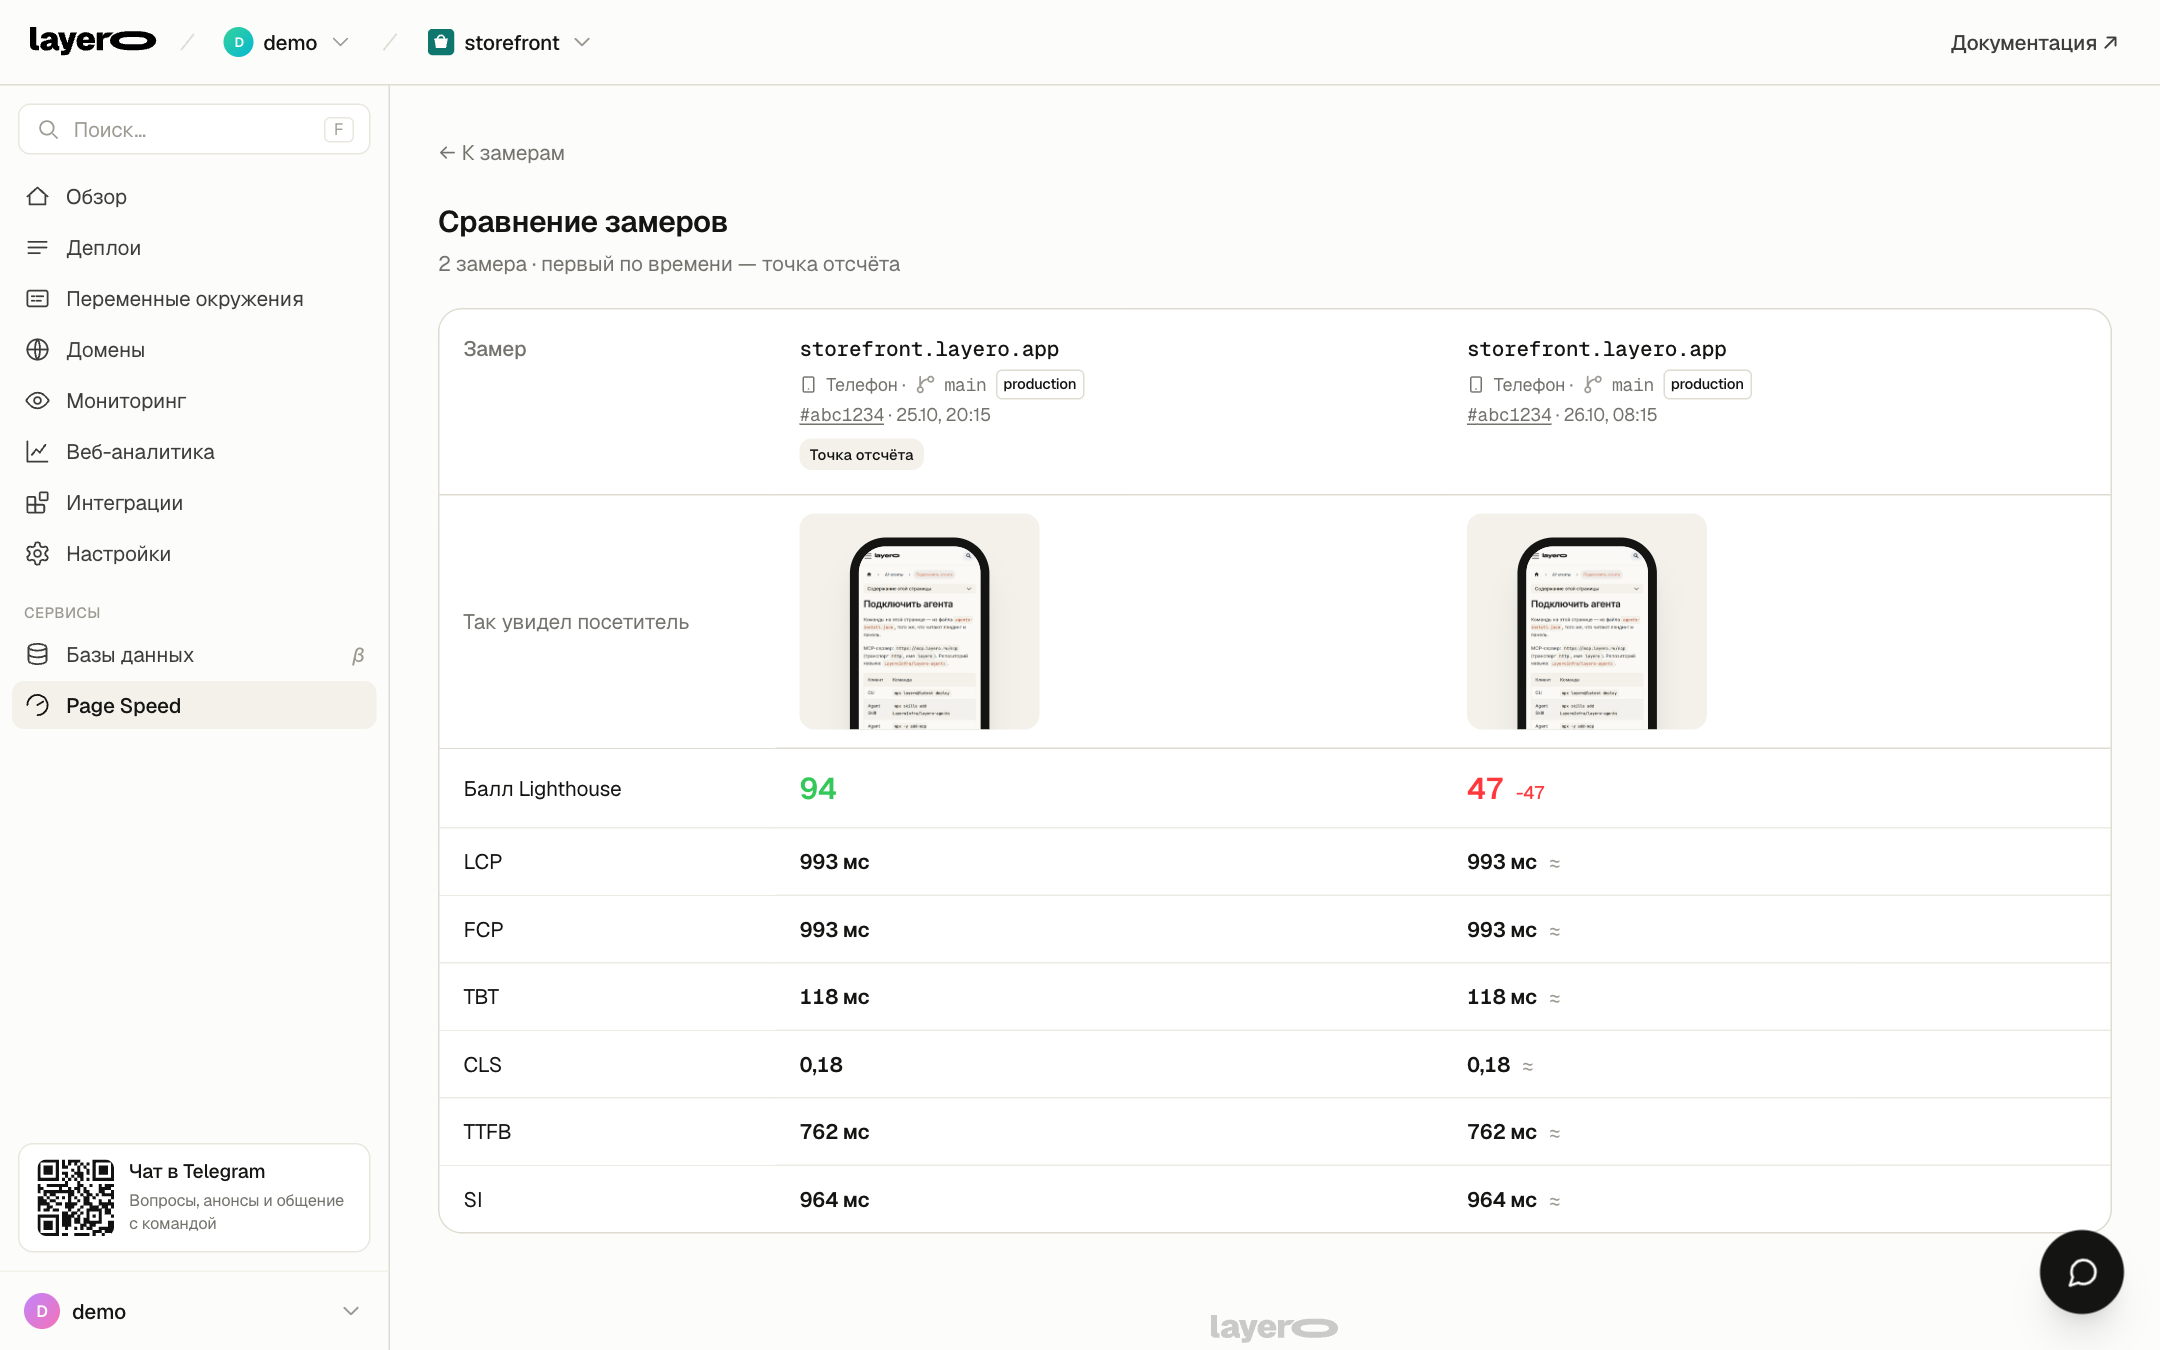
Got worse? You'll see it right away
A new run is compared with the previous scheduled run for the same page and device. You can also select several runs in the list and open them side by side.
Scheduled runs
On the Pro plan a run can start by itself: every 3 or 6 hours, daily or weekly. Runs of one schedule are grouped in the list under its name. With notifications on, the result of every run arrives in Telegram: what changed, which deploys happened and what to fix first.
From the terminal and from an AI agent
Start a run with the CLI: npx layero@latest perf check --device mobile --path /pricing --wait. The result is the same as in the dashboard. AI agents start a run with the MCP tool check_performance.
Measure your site
Page Speed is available on both plans. Free gives 3 runs a month, Pro gives 500 runs a month and scheduled runs.